Figure 2.

The numbers and overlapping of differentially expressed genes in all three treatments as compared with the controls that are inferred using BRB Array Tools.

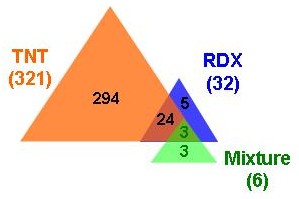
The numbers and overlapping of differentially expressed genes in all three treatments as compared with the controls that are inferred using BRB Array Tools.