
Figure 4.
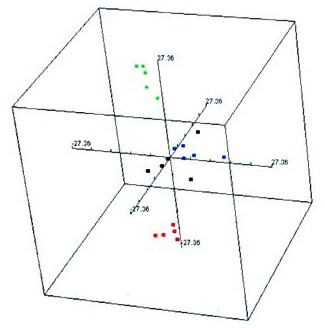
Multidimensional scaling analysis of the 20 earthworm mRNA samples using Euclidean distance and the expression dataset for the 329 significant genes. Color coding for samples: green = control treatment, red = TNT, black = RDX, and blue = mixture.