Figure 5.

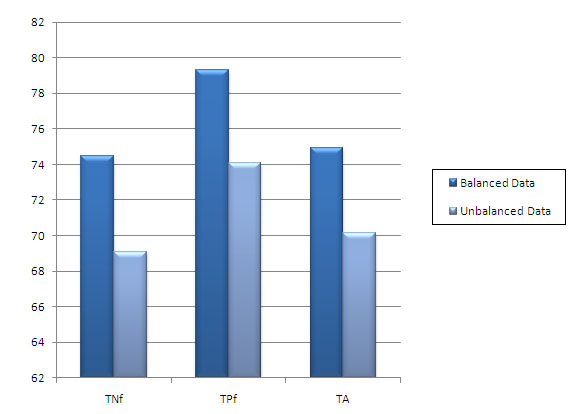
Bar chart comparing TNf, TPf and TA for 420 features dataset with balanced and unbalanced data. SVM is used with Polynomial kernel.

Bar chart comparing TNf, TPf and TA for 420 features dataset with balanced and unbalanced data. SVM is used with Polynomial kernel.