
Figure 6.
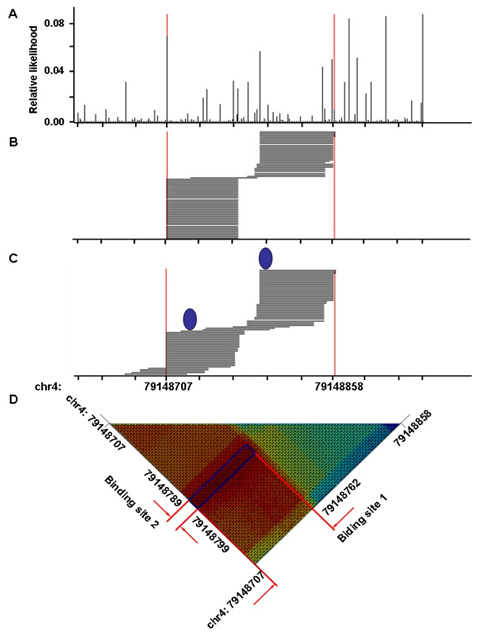
Genomic region that contains two protein binding site. A. Relative likelihood of RNase digestion at each genomic locus. B. Distribution of detected RNA fragments. C. Distribution of simulated fragments based on the best prediction loci (marked as blue ellipse). D. Similarity between the distribution of experimentally-detected amplicons and simulated amplicons assuming that protein binding occurs at the each pair of genomic loci. The blue frame indicates the region where highest similarity is observed (dark red).