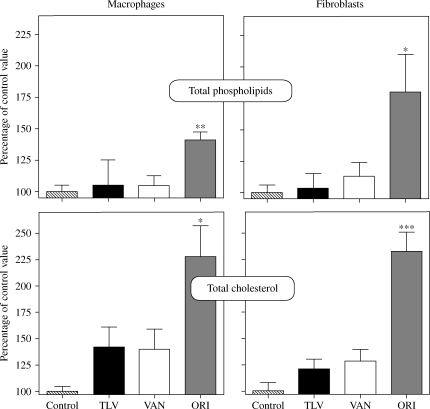
Figure 5.
Total phospholipid content (upper panels) or total cholesterol content (lower panels) of J774 mouse macrophages (left-hand panels) or rat embryo fibroblasts (right-hand panels) exposed for 24 and 72 h, respectively, to glycopeptides at their human Cmax (VAN, vancomycin 50 mg/L; TLV, telavancin 90 mg/L and ORI, oritavancin 25 mg/L). Results are expressed as percentages of control values for total phospholipids and cholesterol. Values are arithmetic means ± SD (n = 6–8). Values for control macrophages and fibroblasts were, respectively, 204 ± 10 and 295 ± 8 nmol/mg of protein for total phospholipids and 72 ± 3 and 130 ± 16 nmol/mg of protein for total cholesterol. Statistical analysis (ANOVA): ***P < 0.001, **P < 0.01, *P < 0.05 when compared with the matching control. Other differences were not significant.

