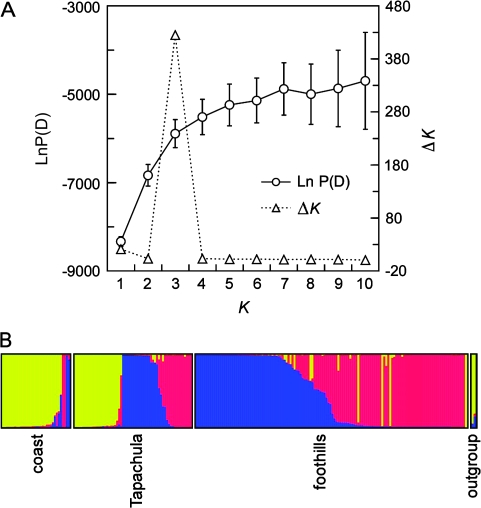
FIG. 1.—
Population structure of Plasmodium vivax in southern Mexico. (A) Plot of the log probability of the data [ln P(D)] and the second-order rate of change constant (ΔK) for K = 1–10. A peak for ΔK at K = 3 suggests that 3 populations best fit the data. (B) Proportional membership of isolates in the 3 clusters identified by the STRUCTURE program. Each isolate is represented by a thin vertical line. Colors identify genetic clusters: yellow, c1; blue, f1; red, f2. Isolates are organized by geographical origin.

