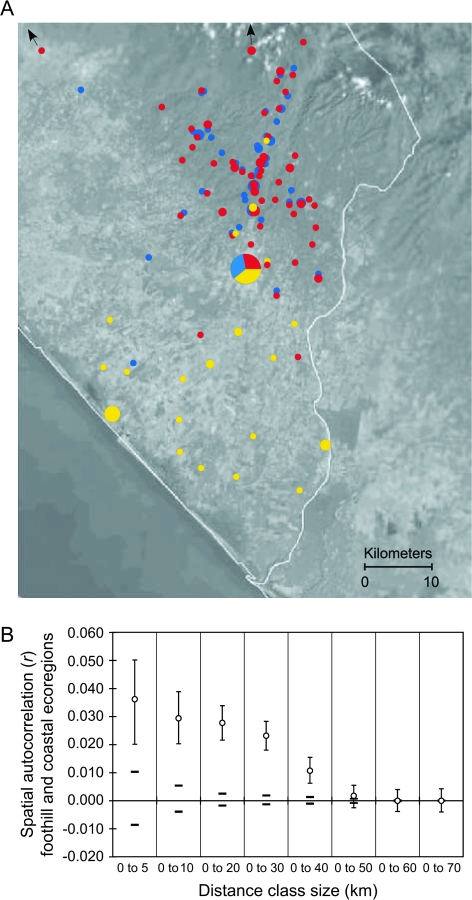
FIG. 4.—
Spatial genetic structure of Plasmodium vivax in southern Mexico. (A) Study area in southern Chiapas State, Mexico. Circle size is proportional to frequency in the sample, with the exception of Tapachula (n = 135). Individuals with mixed ancestry are shown as a single color corresponding to the population with the highest membership proportion. Yellow, c1; blue, f1; red, f2. (B) Spatial genetic autocorrelation (r) across multiple distance classes. Samples from the town of Tapachula were not included. Ninety-five percent CIs for estimates of r based on 1,000 bootstrap replicates are shown as error bars, and 95% CIs based on 1,000 random permutations for the null hypothesis of no spatial autocorrelation are shown by the bold dashes surrounding r = 0.

