Figure 3.
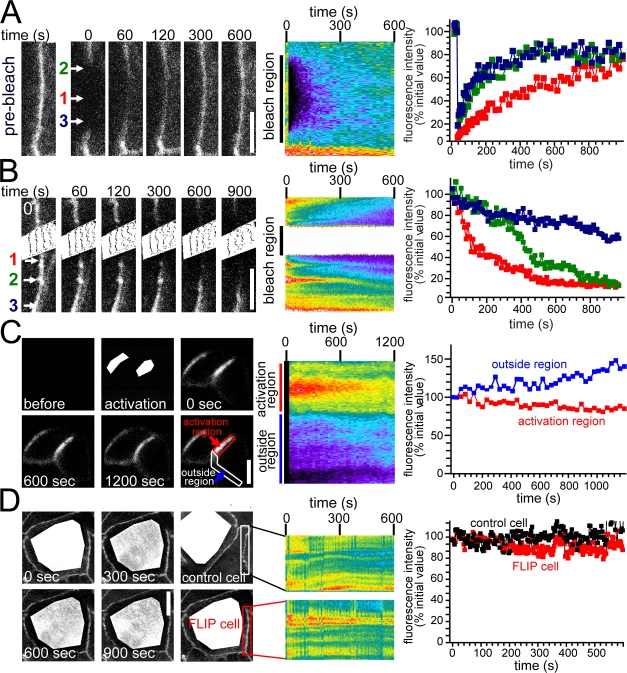
Occludin diffuses within tight junction. (A) EGFP-occludin–expressing cells within confluent monolayers were studied by FRAP after photobleaching elongated tight junction regions. Representative images before and at the indicated time points after photobleaching and the corresponding kymograph are shown. (B) The effect of continuous photobleaching of EGFP-occludin within a region of the tight junction is shown in representative images at the indicated times and in the corresponding kymograph. (A and B) Quantitative analysis of the individual sites indicated by the colored arrows is shown at the right. (C) Fluorescence of PA-GFP was activated in the white areas shown in the image collected during activation. Images collected at subsequent times show diffusion of activated PA-GFP–occludin to adjacent regions. The corresponding kymograph and quantitative analysis of the indicated activation region and adjacent region are shown. (D) The effect of continuous intracellular photobleaching of an EGFP-occludin–expressing cell within a confluent monolayer is shown. The kymographs and quantitative analyses show FLIP analysis of tight junction–associated EGFP-occludin within the indicated regions of photobleached and adjacent control cells. Bars: (A and B) 5 μm; (C and D) 10 μm.

