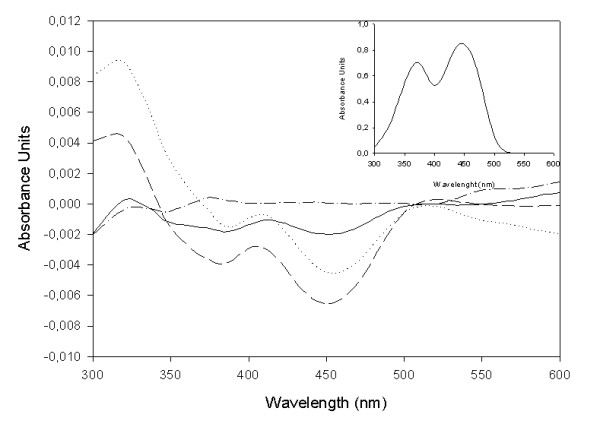
Figure 5.

UV-visible difference spectroscopy. Difference absorbance spectra were recorded from 300 to 600 nm. The difference spectra are as follows: dash-dotted line (-·-), 35 μM MtCS; solid line (--), 35 μM MtCS in the presence of 10 μM FMNox; dashed line (- -), 35 μM MtCS in the presence of 20 μM FMNox; and dotted line (·····), 35 μM MtCS in the presence of 30 μM FMNox. The inset shows absorbance spectrum of 100 μM free FMNox.
