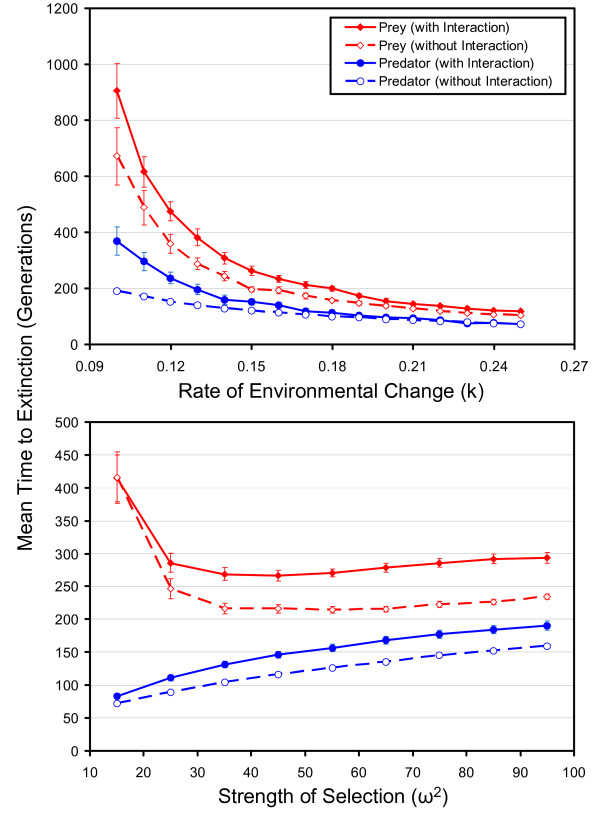
Figure 1.
The effects of a predator-prey interaction on mean extinction times of the two interacting species. The top panel shows the effect under different rates of environmental change, whereas the bottom panel shows the effect for different strengths of selection. In both panels, extinction times of the prey are shown by the red symbols and lines, and those of the predator are shown by the blue symbols and lines. The solid symbols joined by solid lines represent results from experimental runs of the model with the predator-prey interaction intact, whereas the open symbols joined by broken lines show the control runs (in which the predator-prey interaction is removed). Over a wide range of rates of environmental change and strengths of selection, both the predator and prey persist longer when the two species interact than when they do not. Each point represents the mean of 40 runs of the simulation. In the top panel ω2 is 49, and in the bottom panel k is 0.20. The values of k are in units of environmental standard deviations, which are slightly smaller than phenotypic standard deviations in this study. See methods for other parameters used to generate these data.

