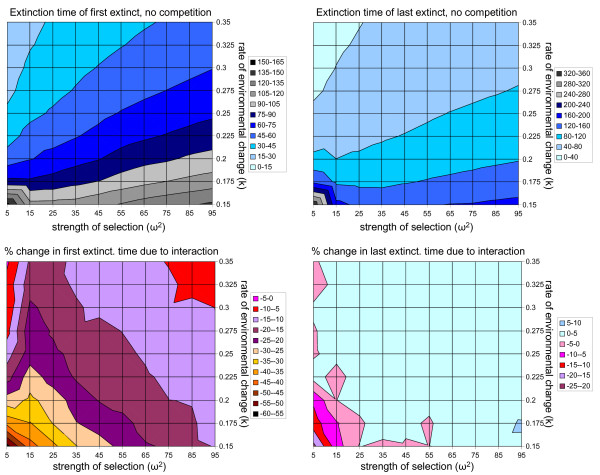
Figure 3.
Results of the competition model under different strengths of selection and rates of environmental change. The top panels show average extinction times for the first species to go extinct (left) versus the last species to go extinct (right) with no interaction between the species. The bottom panels show the percentage change in expected extinction times due to the competitive interaction. Note that the first species to go extinct (which lags the greatest distance from the optimum) always goes extinct more rapidly when competition is present than when it is absent (bottom left). However, under most combinations of parameters, the species closest to the moving optimum persists for longer periods of time when competition is present than when it is absent (bottom right). See Methods and Figure 1 for parameter values.

