
Figure 7. MS/MS spectra of TNF and IL12.
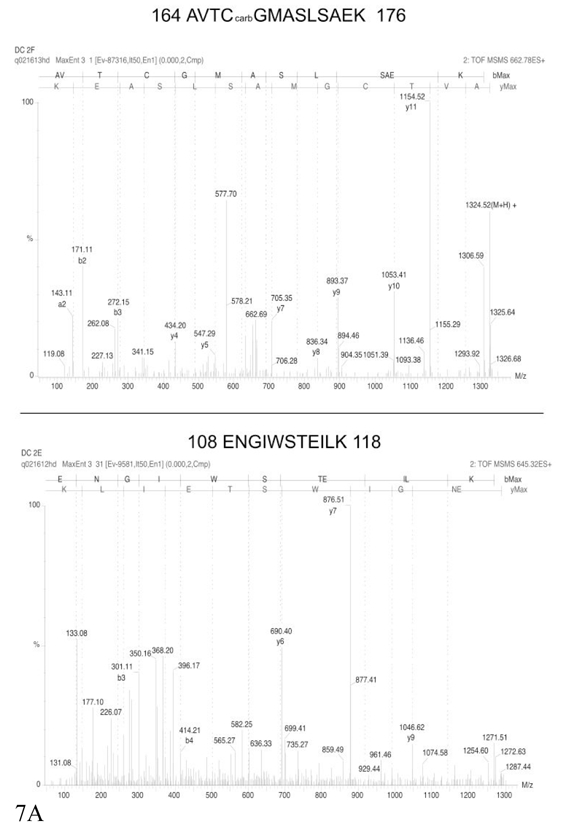
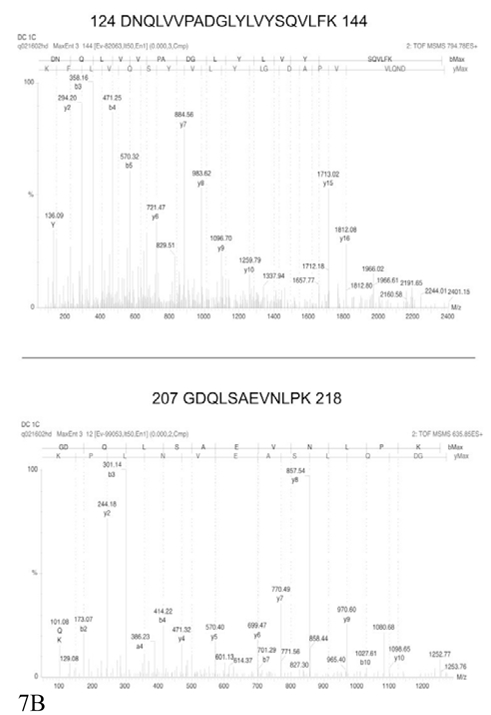
Two annotated MS/MS spectra, covering different parts of the corresponding proteins, are shown for each protein, but the identification is secured by MS/MS data obtained on other peptides (see table 2) Part A: identification of IL12. Part B: identification of TNF