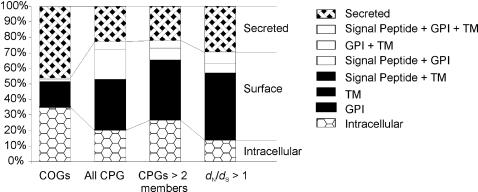
Figure 2. Histogram of predicted location of COG and CPG genes.
Protein products were tested for transmembrane (TM) domains, secretory signal sequences and glycosylphosphatidylinositol (GPI) anchor sequences. Secreted; secretory signal sequence positive TM and GPI-anchor negative, surface; TM or GPI-anchor positive, Intracellular; secretory signal, TM and GPI-anchor negative. COGs, all 1:1:1 T. brucei:T. cruzi:L. major clusters if orthologous genes. All CPG, all T. brucei CPGs. CPGs>2 members, all CPGs tested for positive selection using codon model. d N/d S>1, CPGs subject to adaptive evolution using codon models.

