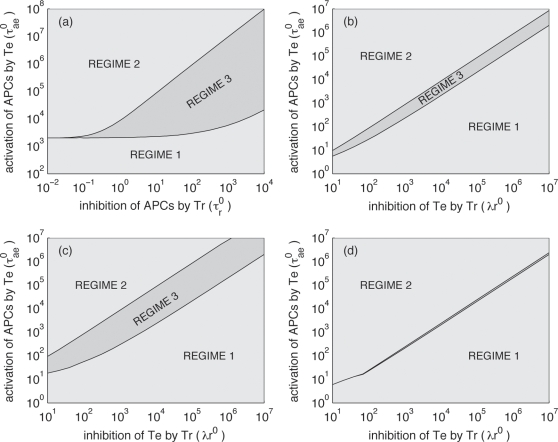
Figure 3. Impact of the parameters on the nature of the equilibrium regime.
Situations are divided into the 3 regimes described in the main text (see also Fig. 2). (a) For different values of the activation rate of APCs by effector cells (τae0) and different rates of regression of APCs by regulatory T cells (τr0), with λr0 = 104; (b) for different values of the activation rate of APCs by effector T cells (τae0) and different rates of inhibition of effector cells by regulatory T cells (λr0), with τr0 = 1; (c) same as (b) but with τr0 = 10; (d) same as (b) but with τr0 = 0.1.

