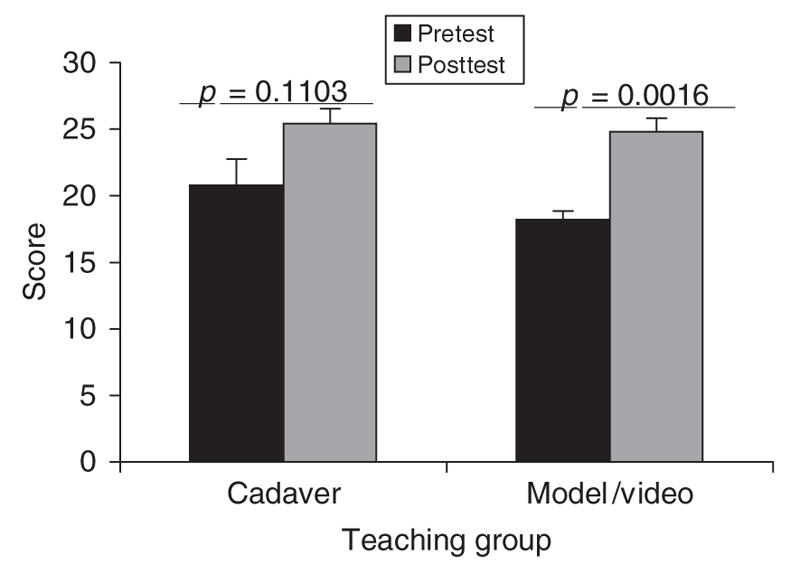
FIG. 3. Pre-and posttest mean scores. The cadaver-based group scored 20.8 (standard error of mean [SEM] 1.98) on the pretest and 25.4 (SEM 1.12) of a possible 34 marks on the posttest, a nonsignificant difference. The composite (model/ video) group scored 18.2 (SEM 0.66) on the pretest and 24.8 (SEM 1.02) on the posttest, a significant improvement.
Difference pretest means 2.6; p = 0.2493; 95% CI 2.23 to –7.43.
Difference posttest means 0.6; p = 0.7027; 95% CI 2.90 to –4.10.
