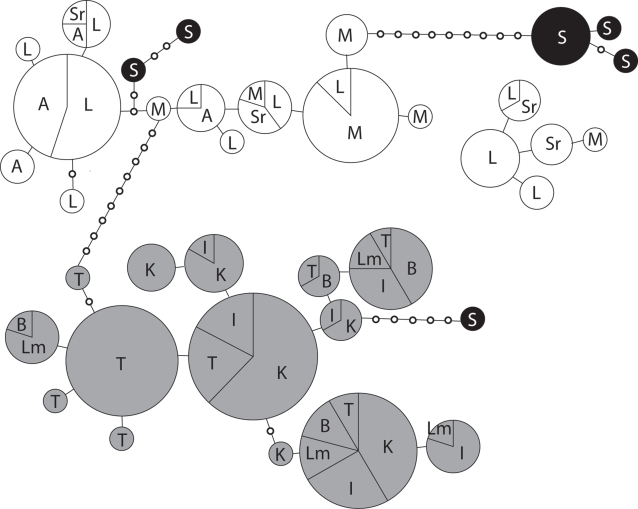
Figure 4. TCS minimum spanning haplotype network based on 782 bp of concatenated COII and Cyt b mtDNA fragments.
Circles are proportional to the total number of individuals sharing each haplotype, while slices are proportional to the number of individuals per population carrying a particular haplotype. Ugandan populations south of Lake Kyoga (T = Tororo, Lm = Lumino, I = Iganga, K = Kamuli, B = Busia) are shown in gray, Ugandan populations north of Lake Kyoga (M = Moyo, L = Lira, A = Apac, Sr = Soroti) are shown in white, and the Sudan population (S = Tambura) is shown in black.

