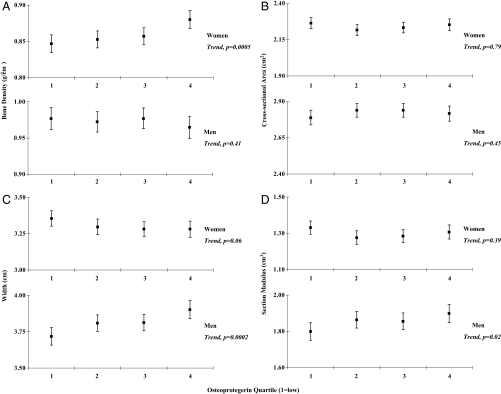
Figure 1.
Bone mineral density (A), cross-sectional area (B), width (C), and section modulus (D) at the femoral neck for women (top panel) and men (bottom panel) according to quartile of plasma OPG concentration (1 = low). Values presented are least squares means (▪) and 95% confidence intervals (Ι) adjusted for age, height, body mass index, current smoking, osteoporosis medications, and estrogen use (women). P values represent tests for linear trend in bone density and geometry indices across quartile of plasma OPG concentration.

