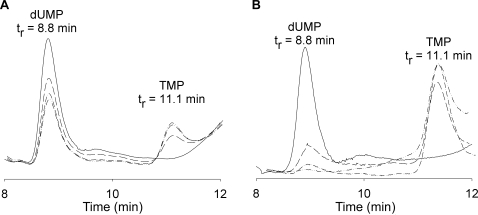
Figure 4. HPLC analysis of M. tuberculosis ThyA and ThyX products.
(A) M. tuberculosis ThyA reaction products. Based on absorbance at 260 nm, the peak corresponding to dUMP (tr = 8.8 min) decreases while the peak corresponding to TMP (tr = 11.1 min) increases over a 120 minute time course (0, 30, 60, and 120 minute time points). (B) M. tuberculosis ThyX reaction products. The peak corresponding to dUMP (tr = 8.8 min) decreases while the peak corresponding to TMP (tr = 11.1 min) increases over a 120 minute time course (0, 30, 60, and 120 minute time points).

