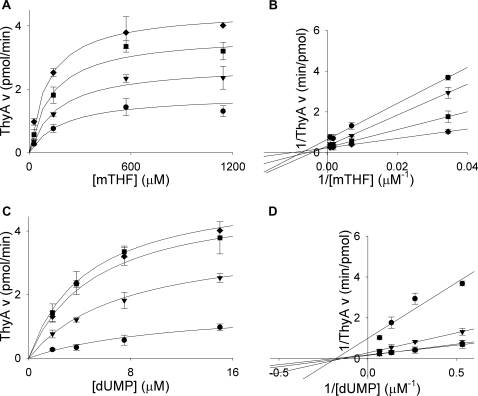
Figure 5. Steady-state kinetics of M. tuberculosis ThyA.
(A) Titrations of mTHF (29, 143, 571, 1143 µM) with varying concentrations of dUMP (•, 1.875 µM; ▾, 3.75 µM; ▪, 7.5 µM; ♦, 15 µM). (B) Double reciprocal plot of data from plot A showing a sequential reaction mechanism. (C) Titrations of dUMP (1.875 µM, 3.75 µM, 7.5 µM, 15 µM) with varying concentrations of mTHF (•, 29 µM; ▾, 143 µM; ▪, 571 µM; ♦, 1143 µM). (D) Double reciprocal plot of data from plot C showing a sequential reaction mechanism. Lines in A and C are plots of Michaelis-Menten equations with calculated constants. Lines in B and D are linear regressions. Error bars are propagation of standard deviations.

