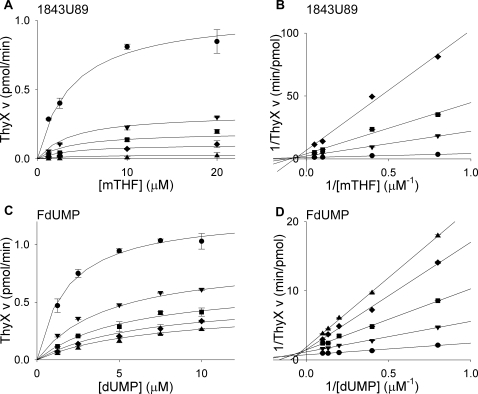
Figure 8. Inhibition of M. tuberculosis ThyX by 1843U89 and FdUMP.
(A) Titrations of mTHF (1.25, 2.5, 10, 20 µM) with varying concentrations of 1843U89 (•, 0 µM; ▾, 25 µM; ▪, 50 µM; ♦, 100 µM; ▴, 400 µM) in the presence of 2.86 µM dUMP. (B) Double reciprocal plot of data from plot A showing a noncompetitive inhibition mechanism. (C) Titrations of dUMP (1.25, 2.5, 5, 7.5, 10 µM) with varying concentrations of FdUMP (•, 0 nM; ▾, 250 nM; ▪, 500 nM; ♦, 750 nM; ▴, 1000 nM) in the presence of 8 µM mTHF. (D) Double reciprocal plot of data from plot C showing a mixed inhibition mechanism. Lines in A and C are plots of Michaelis-Menten equations with calculated constants. Lines in B and D are linear regressions. Error bars are propagation of standard deviations.

