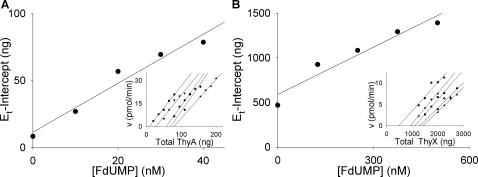
Figure 9. Ackermann-Potter plots of ThyA and ThyX activity.
(A) Graph of x-intercepts from primary plot lines (inset) versus FdUMP concentration (0, 10, 20, 30, 40 nM). Inset plot: titrations of M. tuberculosis ThyA with varying concentrations of FdUMP in the presence of 1200 µM mTHF and 20 µM dUMP. •, 0 nM FdUMP (20, 35, 50, 65, 80 ng ThyA); ▾, 10 nM FdUMP (50, 65, 80, 95, 110 ng ThyA); ▪, 20 nM FdUMP (80, 95, 110, 125 ng ThyA); ♦, 30 nM FdUMP (110, 125, 140, 155 ng ThyA); ▴, 40 nM FdUMP (155, 170, 185, 200 ng ThyA). (B) Graph of x-intercepts from primary plot lines (inset) versus FdUMP concentration (0, 125, 250, 375, 500 nM). Inset plot: titrations of M. tuberculosis ThyX with varying concentrations of FdUMP in the presence of 20 µM mTHF, 20 µM dUMP, 1 mM NADPH, and 10 µM FAD. •, 0 nM FdUMP (1.25, 1.5, 1.75, 2, 2.25 µg ThyX); ▾, 125 nM FdUMP (1.25, 1.5, 1.75, 2 µg ThyX); ▪, 250 nM FdUMP (1.5, 1.75, 2, 2.25, 2.5 µg ThyX); ♦, 375 nM FdUMP (2, 2.25, 2.5, 2.75 µg ThyX); ▴, 500 nM FdUMP (2, 2.25, 2.5, 2.75 µg ThyX). Error bars were omitted to simplify the graphs.

