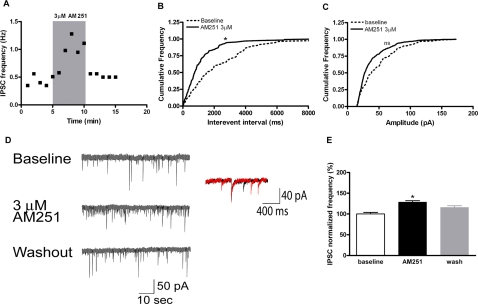
Figure 1. Effect of AM251 on POMC neurons.
A, AM251 increased the IPSC frequency onto POMC neurons: time-effect plot of IPSC frequency from a representative cell in presence of AM251 (3 µM; shaded region); B, Cumulative plot of interevent interval or C, IPSC amplitude from the same cell as A. D, Examples of raw data showing IPSCs before, during and after bath application of AM251 (3 µM; left) with representative kinetics of IPSC (right inset) and conductances before (black) and during peak antagonist effect (red). E, Summary of effect of AM251 on normalized IPSC frequency. (* p <0.05, when compared with baseline; ns,not significant).

