
Figure 1.
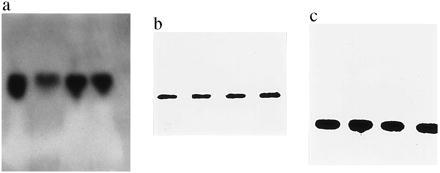
The Northern blot pattern for SOD (a) reveals a single band each in an RR unirradiated mouse (lane 1) or an RR mouse irradiated with 6 Gy (lane 2), in an RS unirradiated mouse (lane 3), and in an RS mouse irradiated with 6 Gy (lane 4). (b) Lanes 5–8 show the pattern for CAT, and lanes 9–12 represent the Northern blot pattern of GSH-PX transcription. (c) Lanes are the same as those given for SOD.