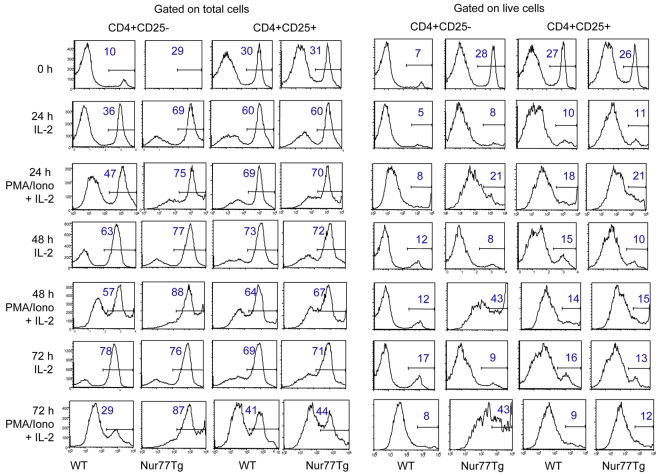
Figure 3. Resistance of Treg cells to activation-induced apoptosis.
CD4+CD25− and CD4+CD25+ were isolated by MACS separation and stimulated in vitro with PMA/ionomycin plus IL-2 for 0, 24, 48 and 72 h (IL-2 alone as no stimulation control). T cell apoptosis at the indicated time points was detected by Annexin V staining and flow cytometry analysis. Histogram data with the figure in each gated population indicating percentage of Annexin V+ cells in the total (left panels) or live (right panels) cell populations. Data are representative of 3 experiments with similar results.

