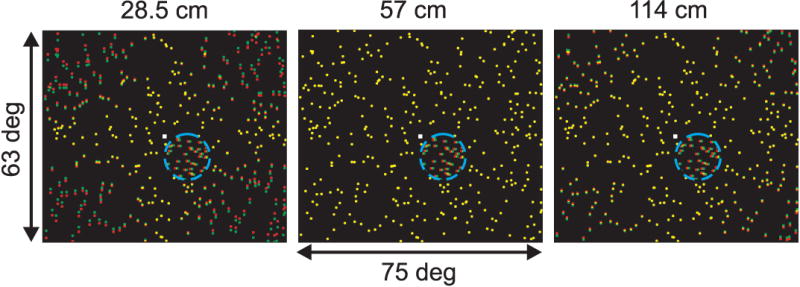
Figure 2.

Illustration of the visual stimuli used to measure the effect of vertical disparities on horizontal disparity tuning in MT. Each panel shows a stimulus with a vertical disparity field that simulates a different viewing distance: 28.5, 57, and 114 cm (left to right). Red and green dots indicate the left and right half-images, respectively. The small white square is the fixation point, and the blue dashed circle (not visible in the actual display) indicates the boundary of the small dot patch that covers the MT receptive field. Dots within the receptive field have only a horizontal disparity and drift in the neurons preferred direction of motion. The horizontal disparity of the small patch of dots is varied across trials to measure disparity tuning curves for each simulated distance.
