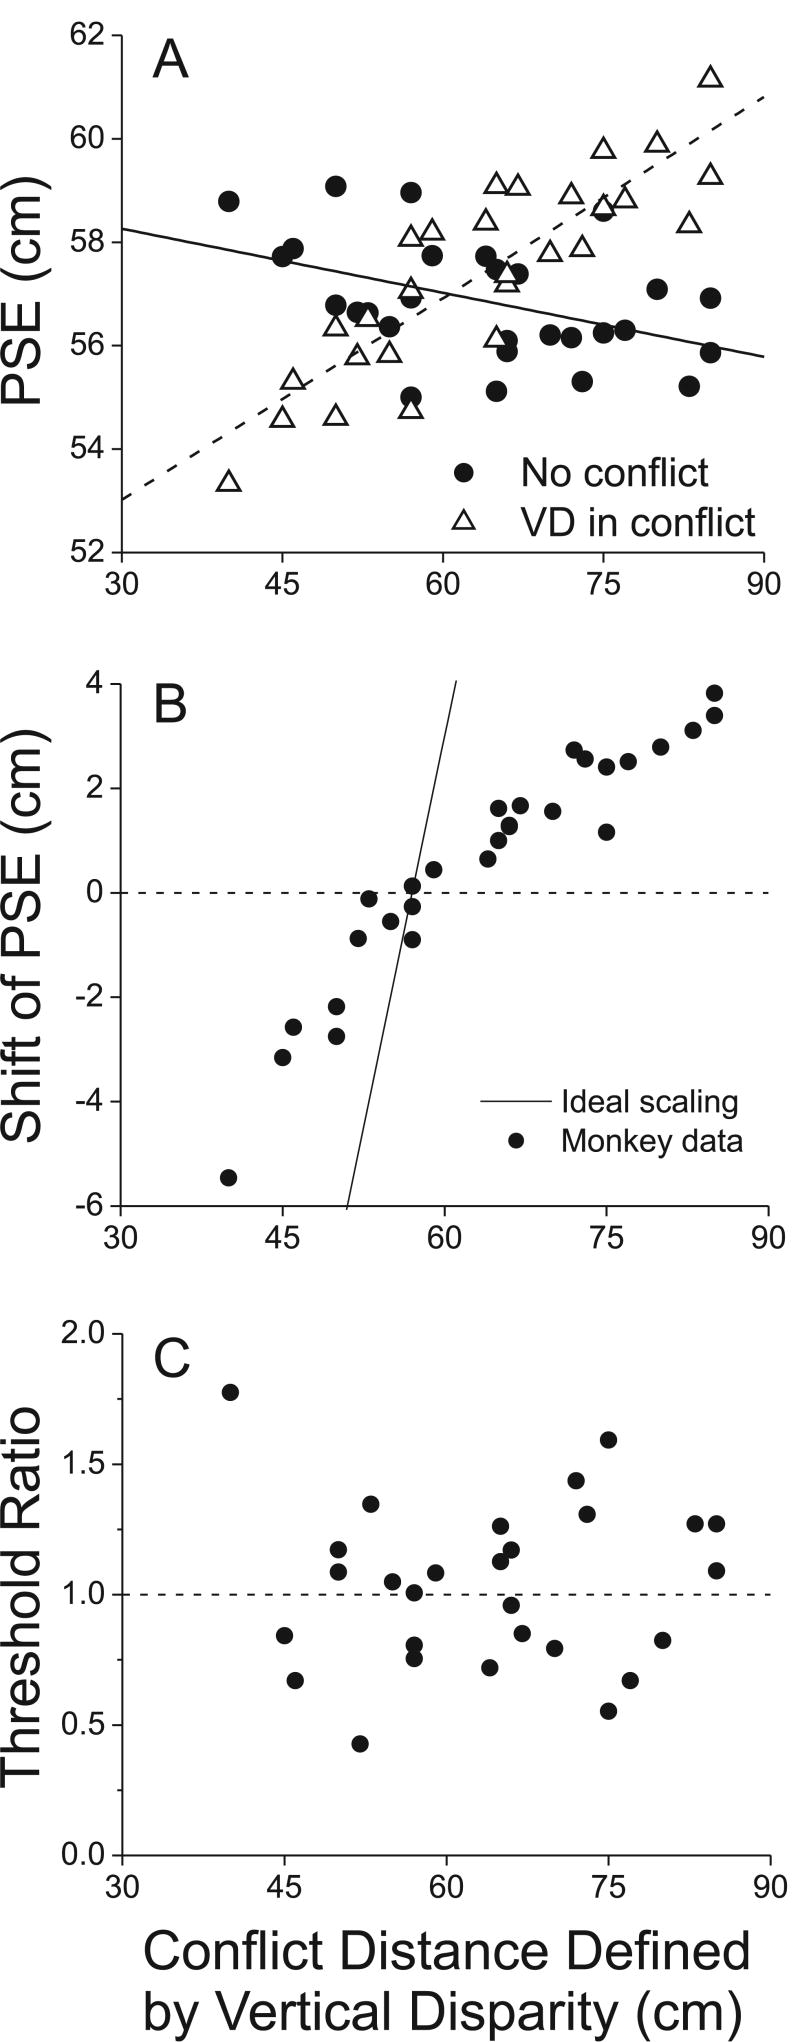
Figure 9.
Summary data showing that vertical disparity biases curvature judgments without affecting sensitivity (N=29 sessions). A) The PSE of the monkey is plotted as a function of the distance simulated by vertical disparities. Open triangles show the PSE from each session when the vertical disparity gradient simulated a viewing distance that was in conflict with the real physical distance of 57 cm (‘VD in conflict’). Filled circles show the PSE from each session when the vertical disparity field was consistent with the physical viewing distance (‘No conflict’). B) The shift of the PSE (horizontal offset between the two psychometric functions) is plotted against the simulated distance defined by the vertical disparity gradient. Note that when vertical disparities simulate a distance >57cm, the PSE shift is positive, whereas vertical disparities that simulated distances <57cm produce negative PSE shifts. B) The ratio of psychophysical thresholds (i.e., slopes of the psychometric functions around 57cm) between the cue-conflict and no-conflict conditions is plotted as a function of the conflict distance defined by vertical disparity. There is no systematic dependence of threshold on the distance simulated by vertical disparity.

