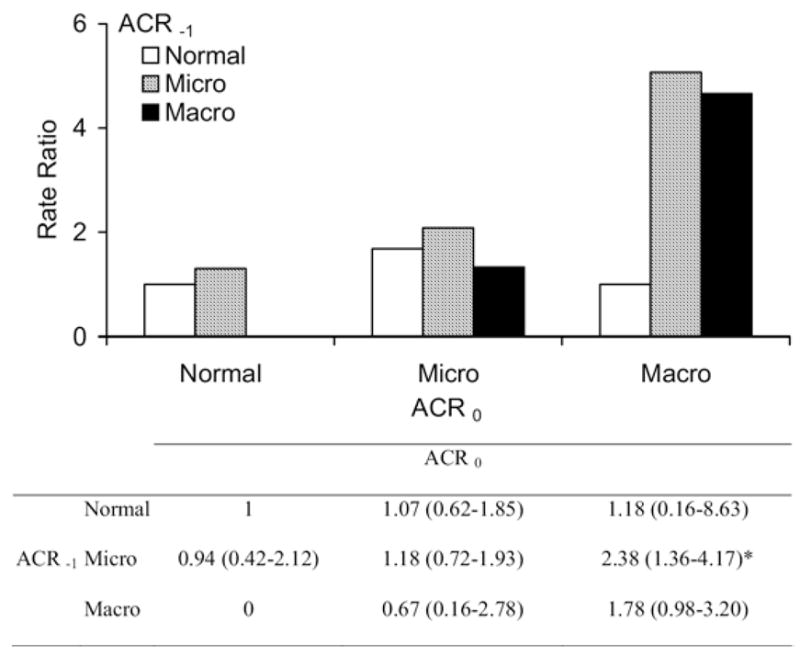
Figure 2.

Unadjusted death rate ratio for natural mortality (N = 144 deaths) relative to persistently normal albumin-creatinine ratio (ACR). The table below the figure comparatively shows hazard ratios for natural death according to change in ACR with 95% confidence intervals adjusted for age, sex, diabetes duration, and antihypertensive medication. Macroalbuminuria (Macro) was truncated at less than 3,000 mg/g. Sample size for each category is listed in Table 2. Abbreviations: Normal, normal ACR; Micro, microalbuminuria; ACR−1, first ACR measurement; ACR0, second ACR measurement. *P < 0.05 compared with the group with persistently normal ACR.
