Fig. 4.
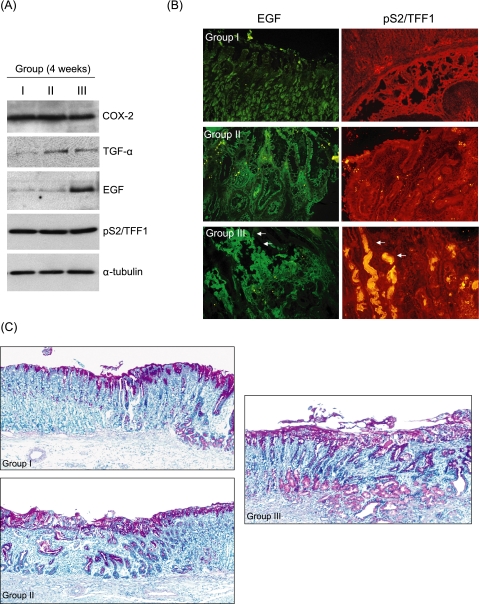
Western blot of COX-2, TGF-α, EGF, and pS2/TFF1 and immunohistochemical staining of EGF and pS2/TFF1 according to group (A) Western blot. The pooled expressions of TGF-α were significantly increased in Group II and III than group I and the expressions of EGF were considerably increased in Group III. There was no significant difference in the expression of either COX-2 or pS2/TFF1. (B) Immunofluoroscence staining for EGF and pS2/TFF1 at ulcer margin. Immunohistochemical stainings of EGF and pS2/TFF1 were significantly increased in Group III. Prominent gastric glands showing high expressions of pS2/TFF1 observed in group III were UACL (ulcer associated cell lineage) (×200 magnification). (C) The change of neutral mucins at the periphery of acetic acids-induced gastric ulcer with Alcian blue mucin staining. The expression of neutral mucin with Alcian blue mucin staining was apparently increased in drug-treated groups (Group II and Group II) than natural healing group (×100 magnification).

