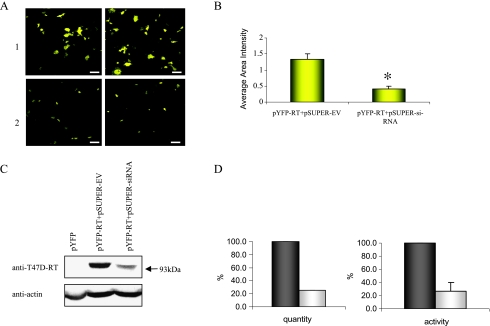
Figure 3.
Knockdown of the chimeric YFP-HERV-K-T47D-RT enzyme. (A) Confocal analysis of the 293T cells cotransfected with: 1) exogenous RT-expressing gene and pSUPER empty vector (EV) or 2) exogenous RT-expressing gene and pSUPER-siRNA. Two representative fields are shown. Scale bars, 50 µm. (B) Comparison of the average fluorescence intensity per area, of 10 different fields (MICA software), between the two transfections shown previously (A). *P = .0001 (analysis of variance). (C) Western blot analysis of an extract of 293T cells transfected with: 1) pYFP-C1, 2) cotransfected with YFP-HERV-K-T47D-RT and with pSUPER-EV, and 3) cotransfected with YFP-HERV-K-T47D-RT and pSUPER-siRNA. The blots were incubated with anti-T47D-RT antiserum (upper panel) and anti-β-actin (lower panel). (D, left panel) The protein expression levels were quantified by densitometric scanning. The signals were normalized to the intensity of signal obtained with the anti-β-actin. Gray bars represent percentage protein levels in cells transfected with pSUPER-EV (100%), and the white bars represent percentage protein levels in cells transfected with pSUPER-siRNA. (D, right panel) Colorimetric RT activity assay was performed with protein extracts form the same transfected cells as in panel (C) (a representative experiment out of three). The activity of the control cells (pSUPER-EV transfectant) were set to 100% (gray bars).

