Figure 2.
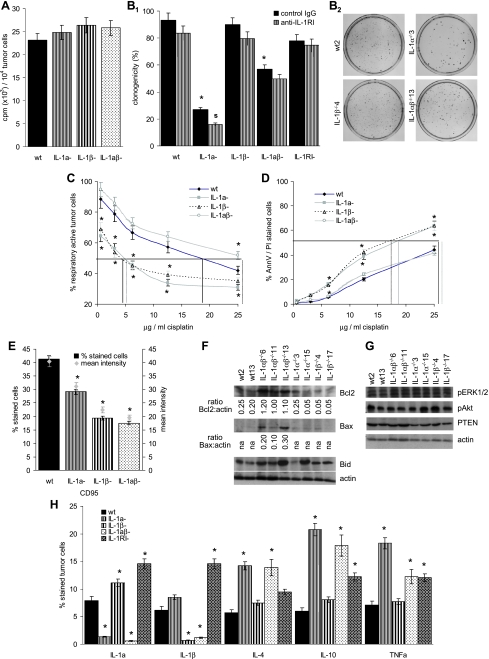
Tumor cell-associated IL-1, proliferation, anoikis, and apoptosis resistance. (A) Three wt, IL-1α-/-, IL-1β-/-, and IL-1αβ-/- fibrosarcoma lines (2 x 10⁴ cells) were grown for 16 hours in RPMI in the presence of 10/µCi of 3H-thymidine and incorporation was determined in a β-counter. (B1) Three wt, IL-1α-/-, IL-1β-/-, IL-1αβ-/- and 2IL-1RI--/- fibrosarcoma lines (102 cells) were suspended in 0.3% agar and seeded on a 1% agar layer. Where indicated, cultures contained 10µg/ml anti-IL-1RI. After 3 weeks of culture, colonies were counted. (B2) Representative examples for one wt, IL-1α-/-, IL-1β-/-, and IL-1αβ-/- fibrosarcoma lines are shown. (C and D) Three wt, IL-1α-/-, IL-1β-/- and IL-1αβ-/- fibrosarcoma lines (1 x 10⁵ cells) were cultured for 48 hours in the presence of 1.56 to 25 µg cisplatin. Survival was evaluated by MTT staining (C) and Annexin V-FITC/PI staining (D). The percentage of live cells (C) and apoptotic cells (D) as compared to cells grown in the absence of cisplatin (100%) is shown (mean values of triplicates). The amount of cisplatin required for a 50% reduction in cell survival is indicated. (E) CD95 expression was evaluated on three wt, IL-1α-/-, IL-1β-/-, and IL-1αβ-/- fibrosarcoma lines by flow cytometry. The percentage of stained cells and the mean intensity of staining is shown. (F and G) Wt, IL-1α-/-, IL-1β-/-, and IL-1αβ-/- fibrosarcoma cells were lysed. Lysates were separated by SDS-PAGE. After transfer, membranes were blotted with the indicated antibodies specific for pro- and antiapoptotic proteins and for pro- and antiapoptotic signal transducing molecules. For Bcl2 and Bax, the intensity ratio in comparison to the actin loading control is indicated. One of 3 representative experiments are shown. (H) Three wt, IL-1α-/-, IL-1β-/-, IL-1αβ-/- and 2 IL-1RI-/- fibrosarcoma lines were tested for cytokine expression by flow cytometry. The mean percentage of stained cells is shown: (A, B1, C, D, E, and H) mean ± SD of the distinct lines are presented and significant differences between wt, IL-1α-/-, IL-1β-/-, IL-1αβ-/- and IL-1RI-/- lines are indicated by an asterisk, a reduction in colony formation (B1) by anti-IL-1RI is indicated by a boldface “s.” Experiments were repeated two to three times and revealed comparable results.

