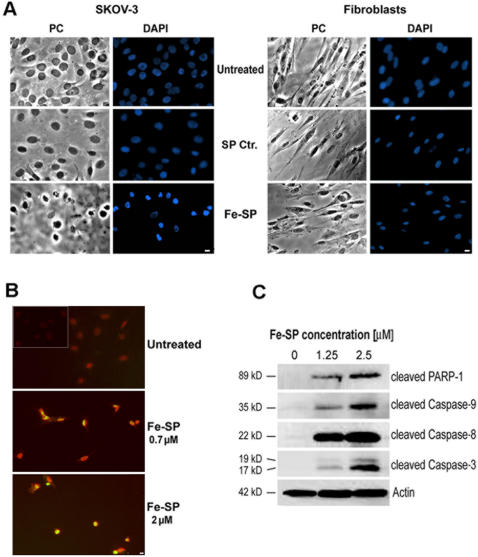
Figure 3. Morphology changes, DNA fragmentation and Caspase activation of ovarian cancer cells and after Fe-SP treatment. (A) Morphological appearance/DAPI staining.
Ovarian cancer cells (SKOV-3) or primary fibroblasts (BJ) were treated for 24 h with Fe-SP or non-complexed SP (Ctr.) at a concentration of 2 µM before microscopic analysis by phase contrast (PC) or fluorescence analysis after chromatin staining (DAPI) as described (Materials and Methods). Images obtained from a representative experiment are shown. Bar = 10 µm. (B) Analysis of DNA Fragmentation in a TUNEL Assay. SKOV-3 cells were treated with Fe-SP (0, 0.7, 2 µM) for 24 h. A TUNEL assay was carried out by co-staining with fluorescein-12-dUTP (labeling of DNA nicks in apoptotic cells) and of chromatin with propidium iodide (Materials and Methods). Co-staining of untreated SKOV-3 cells before fixation and permeabilization served as negative control (insert top panel). During fluorescent microscopy, representative images were taken, apoptotic stain (green) and nuclear stain (red) overlaid. TUNEL positive nuclei due to DNA fragmentation appear as yellow areas. Bar = 10 µM. (C) Western Blot Analysis of Caspase activation. SKOV-3 cells were treated with Fe-SP (0, 1.25 µM, 2.5 µM) for 24 h. PAGE and Western blot analysis of cell lysates was carried out. Activated Caspase-3, -8, -9, and inactivated PARP-1 was visualized by immunoblotting using primary antibodies solely recognizing cleaved fragments, not full length pro-forms, of these proteins in combination with a chemiluminescence detection system as described in (Materials and Methods). A representative experiment is shown. As an internal standard for equal loading (50 µg total cell protein/lane) blots were probed with an anti-β-Actin antibody.

