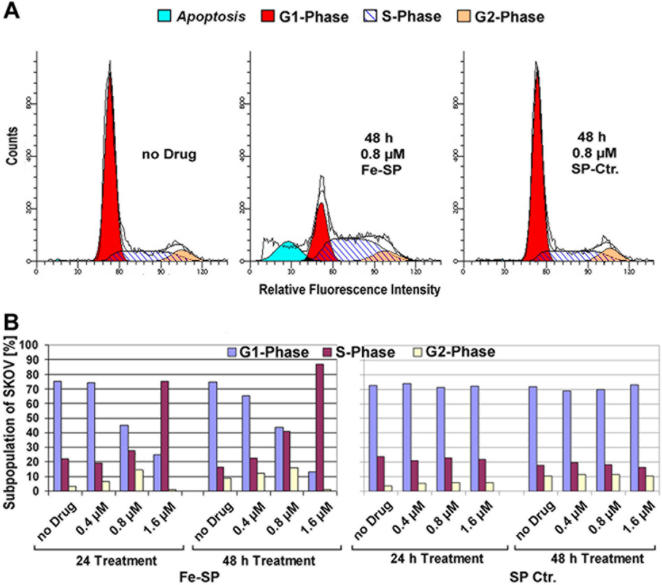
Figure 5. Fe-SP causes S-Phase cell cycle arrest in ovarian cancer cells.
Ovarian cancer cells (SKOV-3) were treated with 0, 0.4, 0.8 and 1.6 µM Fe-SP or SP (Ctr.) for 24 or 48 h. Cell cycle analysis by FACS based on propidium-iodide intercalation into the cellular chromatin was carried out as described (Materials and Methods). Data are presented as (A) relative fluorescence intensity in a 2-dimensional FACS profile (ModFit LT software; black lines = data line and model fit line of entire population; shaded areas = model components/subpopulations of G0/G1, S, G2/M, apoptotic cells), example shown for 48 h treatment with 0.8 µM compound, or as (B) comprehensive bar diagram of all data. Standardized gating was used for all samples. Ten thousand events were analyzed for each sample.

