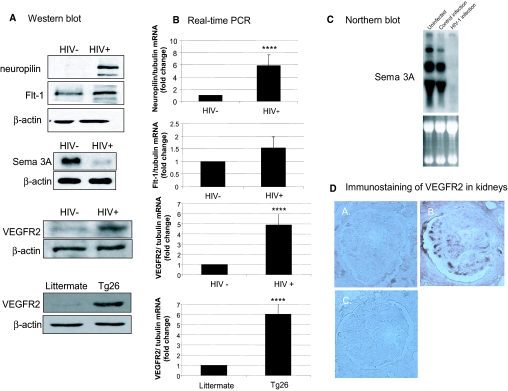
Figure 4.
(A) Effects of HIV-1 infection on protein expression of neuropilin-1, Flt1, VEGFR2, and Sema 3A in podocytes. Neuropilin-1, Flt1, VEGFR2, and Sema 3A expression was determined by Western blot in HIV-infected and control-infected podocytes. VEGFR2 expression was also examined in podocytes isolated from Tg26 mice and their littermates. These are representative blots of three independent experiments. (B) The neuropilin-1/tubulin, Flt1/tubulin, and VEGFR2/tubulin ratios were determined by real-time PCR. The fold of increase as compared with control podocytes is expressed. Means ± SEM of three independent experiments are shown. ****P < 0.001 versus control. (C) Northern blot analysis of Sema 3A expression was performed using RNA from podocytes infected with HIV-1 versus the control construct and uninfected podocytes. A representative blot of three independent experiments is shown demonstrating dramatic reduction in the expression of Sema 3A in response to the HIV-1 transgene as compared with the control infection (top). The ethidium bromide–stained RNA gel before transfer is shown to demonstrate that equivalent amounts of RNA were used for the analysis (bottom). (D) Immunostaining of VEGFR2 in kidney biopsies from patients with HIVAN (B) compared with patients with minimal-change disease (A) and IgG control (C).

