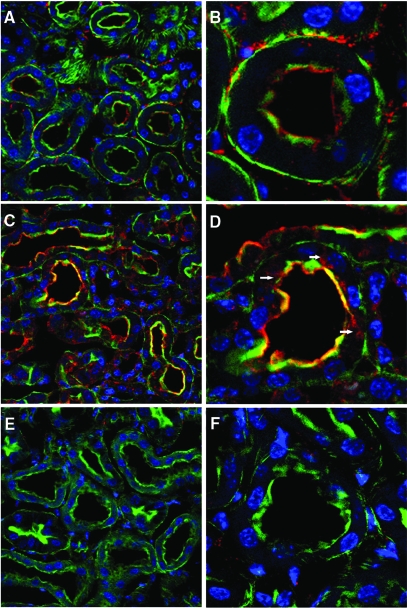
Figure 9.
Immunofluorescence localization of TLR4 after injection of saline or cisplatin. Representative kidney sections obtained from C57BL/6 (A-D) or Tlr4(−/−) (E and F) mice 48 h after injection. Green fluorescence represents FITC-phalloidin staining of the brush border. Red fluorescence represents TLR4 immunostaining. Blue represents DAPI staining of nuclei. (A) Saline-treated C57BL/6; TLR4 staining is seen in the interstitium and brush borders of proximal tubules (original magnification ×40). (B) A single tubule at higher magnification (original magnification ×100). (C) Cisplatin-treated C57BL/6 (original magnification ×40) shows enhanced brush border staining with clear colocalization of TLR4 and phalloidin. (D) Intracellular TLR4 staining (arrowheads) is also apparent at higher magnification (original magnification ×100). (E-F) Saline-treated Tlr4(−/−) kidneys as a negative control for TLR4 immunostaining.

