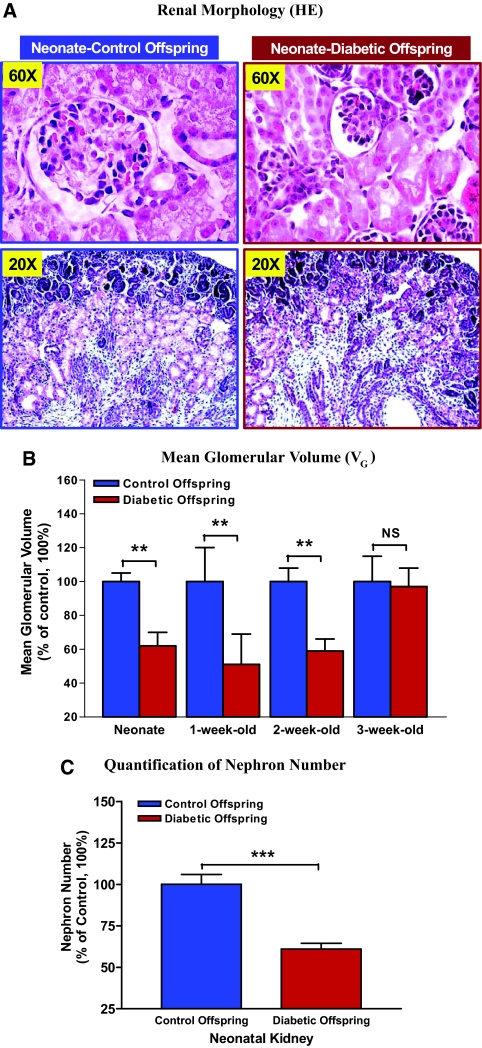
Figure 3.
Renal morphology and VG measurement. (A) hematoxylin and eosin (HE) staining indicates that kidney and glomerular size of neonatal offspring from diabetic mother (right) are smaller as compared with control offspring (left). (B) Quantification of VG value in control and diabetic offspring from neonate to 3 wk of age. The y axis shows the percentage of VG value compared with control animal (100%). Blue bar, control offspring (neonate: n = 9; 1 wk old: n = 12; 2 wk old: n = 9; 3 wk old: n = 8); red bar, diabetic offspring (neonate: n = 8; 1 wk old: n = 8; 2 wk old: n = 7; 3 wk old: n = 8). **P ≤ 0.01. (C) Quantification of neonatal nephron number. The y axis shows the percentage of nephron number compared with control animal (100%). Blue bar, control offspring (neonate: n = 6); red bar, diabetic offspring (neonate: n = 5). ***P ≤ 0.001.

