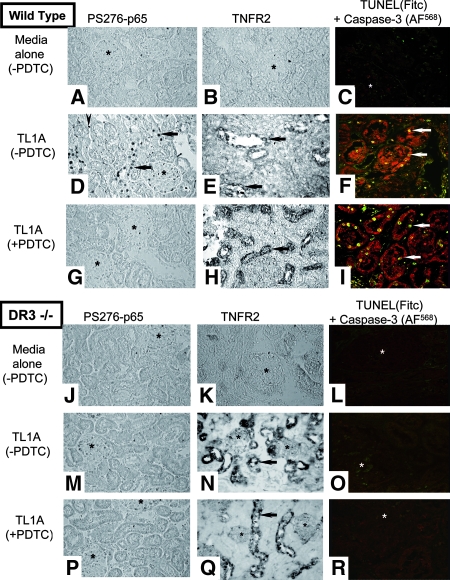
Figure 5.
TL1A responses in WT and DR3−/− mouse kidney organ cultures. Unstimulated cultures from WT mice (without PDTC) are negative for P-S276-p65 (A), TNFR2 (B), and active caspase-3/TUNEL (C). In contrast, TL1A-treated cultures (D through F) show a strong signal for P-S276-p65 in TEC (arrows) and in MNC infiltrate (arrowhead) and a strong signal for TNFR2 (E) and active caspase-3/TUNEL (F) in TEC (arrows). TL1A-treated cultures (pretreated with PDTC) show a diminished expression for P-S276-p65 (G) but a strong signal for TNFR2 (H) and active caspase-3/TUNEL (I) in TEC (arrows). In DR3−/− mice (without PDTC), unstimulated cultures are negative for P-S276-p65, TNFR2, and active caspase-3/TUNEL (J through L). TL1A-treated cultures are negative for P-S276-p65 (M) but positive for TNFR2 (N) with a similar pattern of staining as WT animals and are negative for active caspase-3/TUNEL (O). TL1A-treated cultures (pretreated with PDTC; P through R) show similar pattern of staining as cultures without PDTC. Glomeruli (*). Magnification, ×253.

