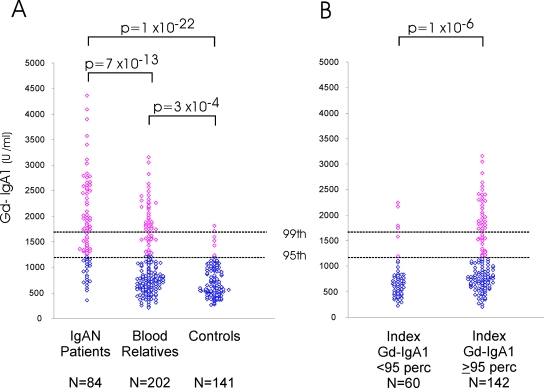
Figure 2.
(A) Distribution of Gd-IgA1 levels in sporadic IgAN patients (n = 84), their blood relatives (n = 202), and unrelated controls (n = 141). The dashed horizontal lines indicate the 95th and 99th percentile cutoffs for controls. Values above the 95th percentile are shown in red. (B) Distribution of Gd-IgA1 levels in relatives, after stratification based on Gd-IgA1 levels in the index case. The P values for comparisons between the different groups are shown.

