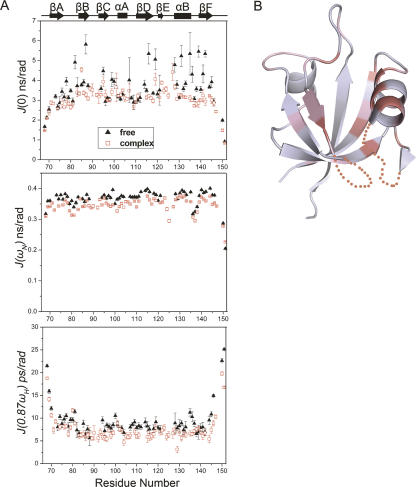
Figure 7.
Reduced spectral density function analysis and mapping of the residues with slow internal motions onto the structure of the apo LARG PDZ. (A) Spectral density functions J(0), J(ω N), and J(0.87ω H) and their uncertainties were calculated for the apo (▲) and peptide-bound (□) LARG PDZ. (B) Structure of the apo LARG PDZ. Residues showing J(0) > 4.51 ns/rad (the mean value plus one standard deviation) are colored deep pink; residues with J(0) values between 3.59 nsc/rad (mean value) and 4.51 ns/rad are colored light pink.

