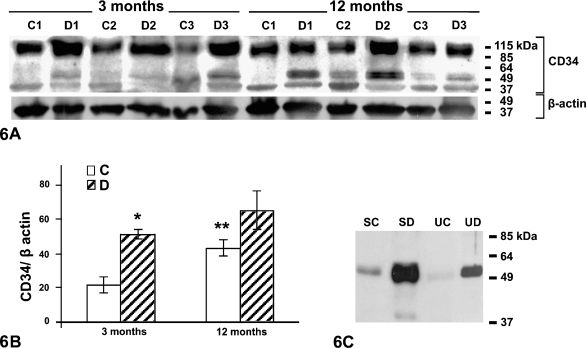
Figure 6.
Western blotting revealing CD34. (A) Glomerular homogenates of control and diabetic young and old animals. A major band of 95 kDa is observed in all samples. A minor band at 47 kDa is also observed in all samples, whereas a minor band at 54 kDa is particularly detected in tissues of young diabetic animals and those of normal and old diabetic animals. Molecular mass markers are indicated. In the lower panel, β-actin bands are shown as loading reference. (B) Densitometric analysis of the 95-kDa band from glomerular samples. Significant increase in intensity (asterisk) is observed for the young diabetic animals with respect to their age-matched controls and for older normoglycemic animals (double asterisk) with respect to young normoglycemic ones. C, control animals; D, diabetic animals; n=3. (C) Serum (S) and urine (U) samples of old control and old diabetic animals. A single 54-kDa band is detected in the serum of old control (SC) and diabetic animals (SD), being more intense in the latter (SD). Urine of old control (UC) and old diabetic (UD) animals also show a 54-kDa band, which is very faint in the former and strong in the latter. Molecular mass markers are indicated on the right side of the panel.

