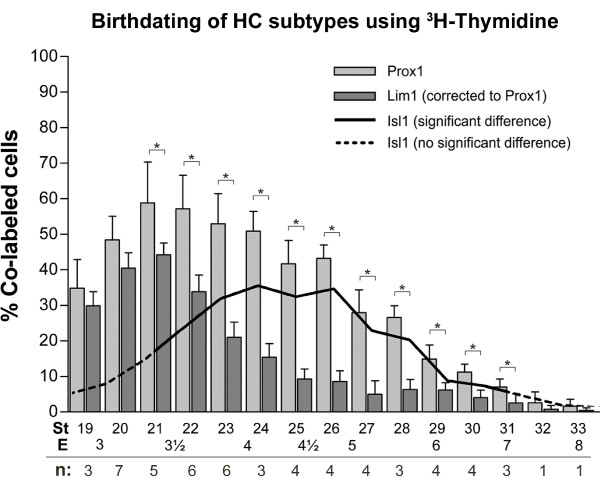
Figure 2.
Lim1 and Isl1 horizontal cell subgroups have different birth-dates. Fractions of HCs positive for [3H]-dT incorporation combined with either Prox1 (light grey bars) or Lim1 (dark grey bars) analysed at st35 (expressed as % ± s.d., * p < 0.05 using the Student's t-test, n = number of animals that were analysed for each stage). The line indicates the difference between the Prox1 and Lim1 [3H]-dT-labelled fractions, and represents the birth curve for Isl1+ HCs. Solid portion of the line corresponds to significant differences. St: stage (of [3H]-dT injection), E: embryonic day.

