Figure 3.
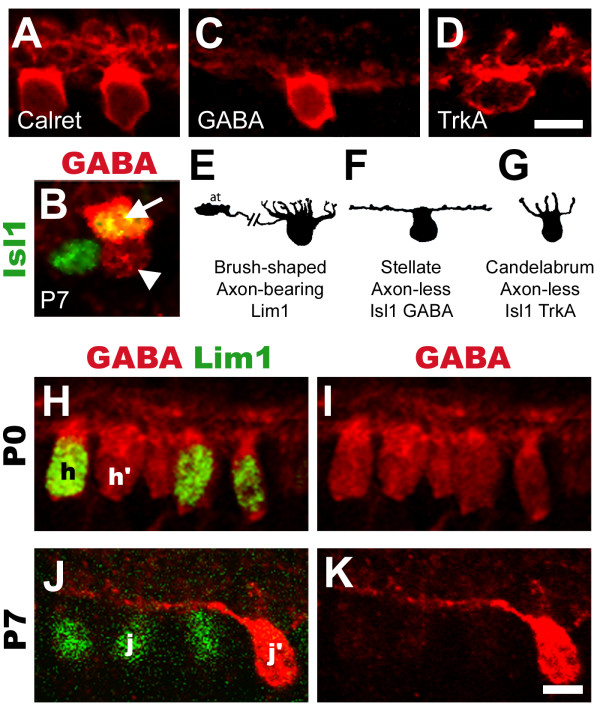
Confocal analysis of horizontal cell morphology and changes in GABA expression levels after hatch. (A): Axon-bearing, brush-shaped HCs visualised by calretinin. (B): Flat-mounted P7 retina. GABA antibodies (red) label a fraction of Isl1+ HCs intensely (green, arrow, co-expression is yellow), and label Lim1+ HCs to a lesser extent (arrowhead). (C): Axon-less stellate HCs visualized by intense GABA labelling. (D): Axon-less candelabrum-shaped HCs visualised by TrkA. (E-G): Morphology of chick HCs as they appear in Gallego, 1986 [6] with names and molecular attributes denoted below. (H-K): P0 (H-I) and P7 (J-K) HCs labelled for GABA (H-K, red) and Lim1 (H and J, green). Uniform GABA levels are found in both Lim1+ and Lim1-HCs at P0 (compare h with h') whereas Lim1+ HCs express low levels of GABA at P7 (compare j with j'). Scale bars are 5 μm (valid for A-D and H-K).

