Figure 8.
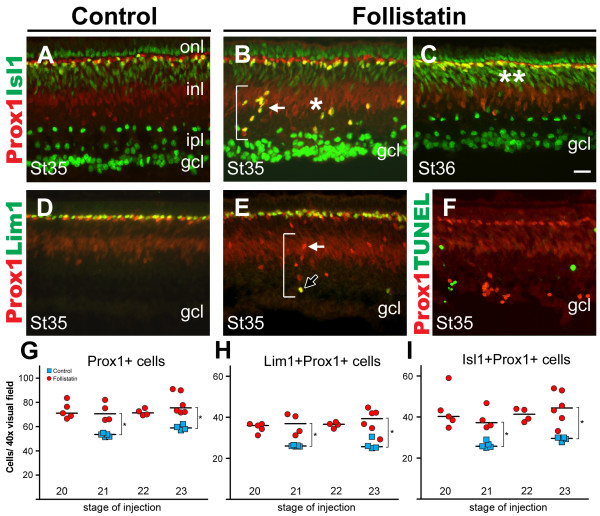
Follistatin treatment at E3 increase the number of horizontal cells at E9. (A-F): Retinal cross-sections stained for Prox1 (A-F, red) combined with Isl1 (A-C, green), Lim1 (D-E, green) or TUNEL (F, green). Co-labelled cells appear yellow. Compared to st35 control retinas (A and D) follistatin treated retinas (B, C and E) have ectopic Prox1+ cells in the inner retina which are often arranged in columns (B and E, brackets). These ectopic Prox1+ cells are primarily of the Isl1+ HC subtype (white arrows), although some are Lim1+ (E, black arrow). (C): At st36, ectopic HCs have migrated to the HCL (compare double asterisks with single asterisk in B). (F): St35 Prox1 and TUNEL-staining reveal no overlap. (G-I): Quantification at st35 of the number of HCs in 40× visual fields following follistatin treatment at various E3-stages. Blue squares indicate the means of individual control treated animals and red circles indicate the means of individual follistatin-treated animals. The medians are indicated by a black line. Follistatin causes a significant increase in the number of HCs (Prox1+) and HC subtypes (Lim+ or Isl1+ HCs) at all stages, compared to controls (* p < 0.05, Mann-Whitney test, see also Additional file 3). Scale bar is 20 μm (valid for A-F).

