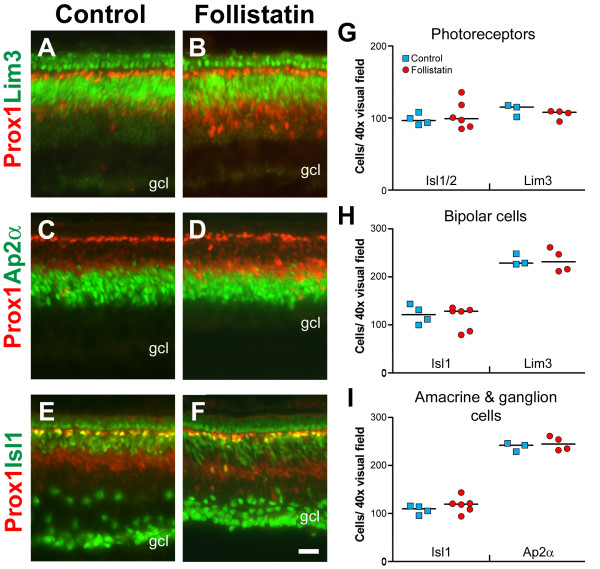
Figure 9.
Effects on other cell populations following follistatin treatment. Control (A, C, and E) or follistatin-treated retinas (B, D, and F) stained for Prox1 (A-F, red) and Lim3 (A-B, green), Ap2α (C-D, green) and Isl1 (E-F, green). All injections were made at st23 and analysed at st35. With respect to the thickness of immuno-labelled bands, all markers appear grossly normal after follistatin injection. (G-I): Quantification of immuno-labelled cells in 40× visual fields. Blue squares indicate the means of individual control treated animals and red circles indicate the means of individual follistatin-treated animals. The medians are indicated by a black line. Using the above markers, no significant differences (p < 0.05, Mann-Whitney test) were found between control or follistatin treated retinas with respect to the number of photoreceptors, bipolar cells, amacrine cells or ganglion cells. Note that the Isl1+ cells quantified in 9I include both Isl1+ ganglion and amacrine cells. Scale bar is 20 μm (valid for A-F).

