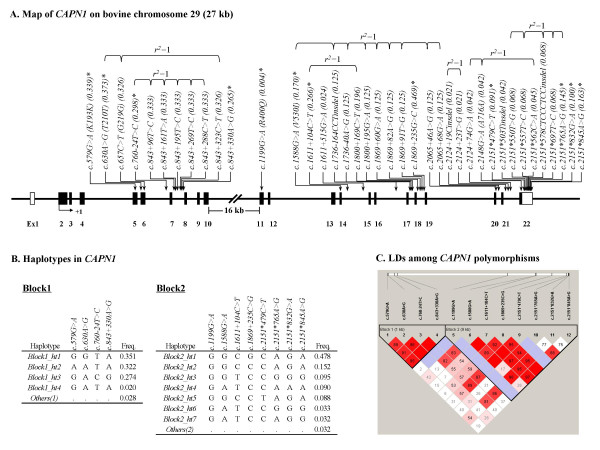
Figure 1.
Gene map, haplotypes, and linkage disequilibrium in CAPN1. A. Gene map and polymorphisms in CAPN1 on chromosome 29. The coding exon is marked by black blocks, and 5' and 3' UTRs by white blocks. The first base of the translational site is denoted as nucleotide +1. Asterisks (*) indicate polymorphisms genotyped in a larger Korean native cattle cohort (n = 421). B. Haplotypes in CAPN1. Haplotypes with frequency >0.02 are presented. Others contain rare haplotypes: (1)AGTA, GACA, and GGCA; and (2) GATCCGGA, GATGCAGA, GGCGCAAA, and GATGCGGA. C. Linkage disequilibrium (LD) and LD blocks among CAPN1 polymorphisms are shown using Haploview. The color code on the Haploview plot follows the standard color scheme: white (|D'| < 1, LOD < 2); shades of pink/red (|D'| < 1, LOD ≥ 2); blue (|D'| = 1, LOD < 2); bright red (|D'| = 1, LOD ≥ 2). The numbers in cells are D' values. However, the D' values of 1.0 are not shown (empty).

