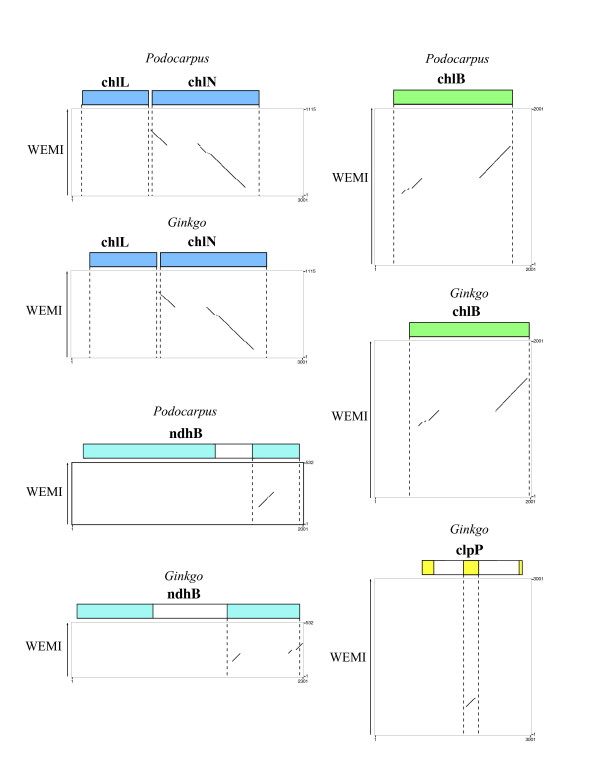
Figure 3.
Harr plots comparing sequence from the Welwitschia plastome with homologous regions from Podocarpus and Ginkgo. The extent of genes found in each region of the Podocarpus and Ginkgo plastomes are shown at the top of each graph as colored boxes. The Welwitschia (WEMI) sequence is represented as the Y-axis. Diagonal lines indicate regions of similarity between the two sequences being compared. Most portions of these genes found in Podocarpus and Ginkgo lack equivalent sequence in Welwitschia and the sections exhibiting similarity are disjointed.

