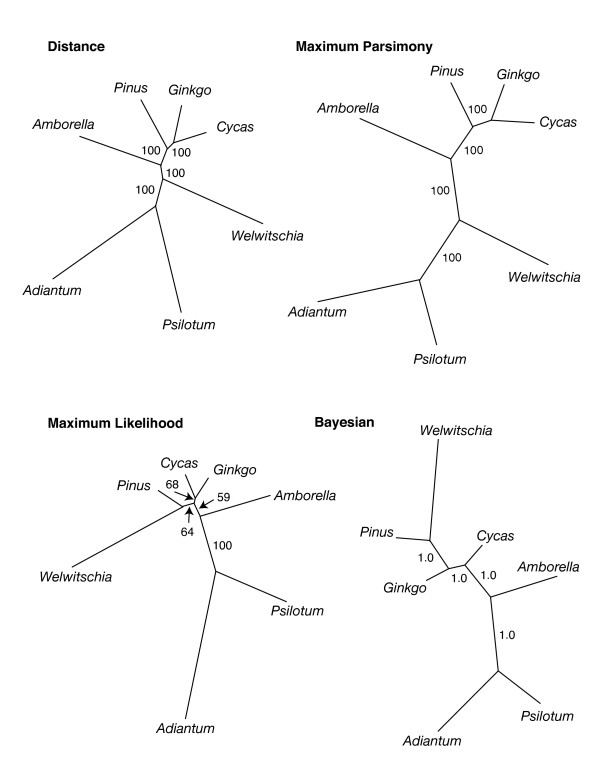
Figure 4.
Phylogenetic hypotheses obtained using different optimization criteria based on 57 protein-coding plastid genes. Values associated with branches indicate the level of bootstrap support or, for the Bayesian analysis, posterior probability. Branch lengths are shown proportional to inferred amount of change in all trees.

