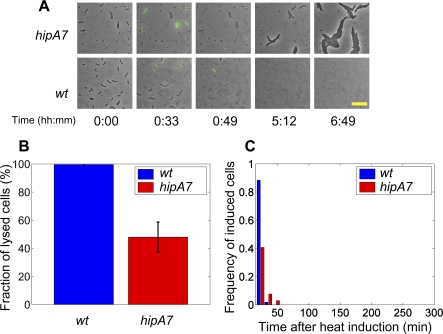
Figure 2. Single-Cell Observation of Persistence Following Heat Induction for Wild-Type and hipA7 λcI857KnR Lysogens.
(A) Superposition of phase-contrast and fluorescence images acquired by time-lapse microscopy of wt and hipA7 strains carrying λcI857KnR prophage during and after heat induction. At t = 0, lysogenic bacteria are exposed to 42 °C for 80 min. The temperature is then set back to 32 °C. Videos were acquired in parallel at several different locations. At the end of the measurements, no survivors are observed in the wt, whereas a number of dividing cells can be seen in the hipA7 strain. Scale bar indicates 20 μm.
(B) Percentage of lysis following heat induction, based on phase microscopy over the total observation period (8 h). More than 50% of the hipA7 population does not lyse, showing the existence of persisters. Error bars represent the standard deviation between two separate microscopy experiments, on a total of approximately 1,400 cells for each strain.
(C) Monitoring of late promoter pR′-tR′-gfp onset of fluorescence (in lysing cells only). Histograms are normalized to the total number of cells that were followed individually (approx. 250 cells each). Onset of fluorescence occurs within 1 h following heat induction, and no induction events were observed in the subsequent 4 h of continuous observation.

