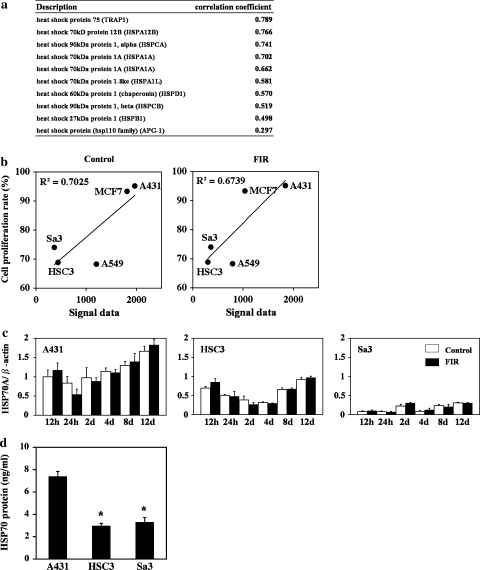
Fig. 2.
Relationship between the expression of HSP70 and the suppression of proliferation by FIR irradiation. (a) Correlation between the signal from the microarray for the HSP family members in the control group and the correlation coefficient. (b) Correlation between the signal from the microarray for HSP70 and the growth rate in the control and the FIR-treated cells. (c) Expression of HSP70A mRNA in A431, HSC3, and Sa3 cells after 0.5, 1, 2, 4, 8, and 12 days of culture. The level of these mRNAs was determined by quantitative real-time RT-PCR. Bars represent the means and error bars the SD from three independent experiments. (d) Level of HSP70 protein on day 4 of culture. The concentration of HSP70 protein was measured by ELISA. Bars represent the mean, and error bars the SD (n = 4). *P < 0.01 vs. to A431 cells

