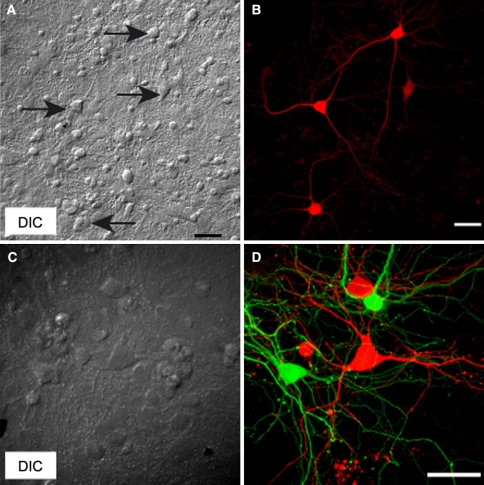
Fig. 6.
DNA transfection of primary cultured neurons. (A, B) A DIC image (A) and a fluorescence image (B) of primary hippocampal neurons 24 h post-transfection with mRFP1 plasmid DNA. Stabbed neurons are indicated by arrows in A. (C, D) A DIC image (C) and fluorescence image (D) of primary hippocampal neurons 24 h after differential transfection of Venus and mRFP1 plasmid DNA. Scale bar, 50 μm

