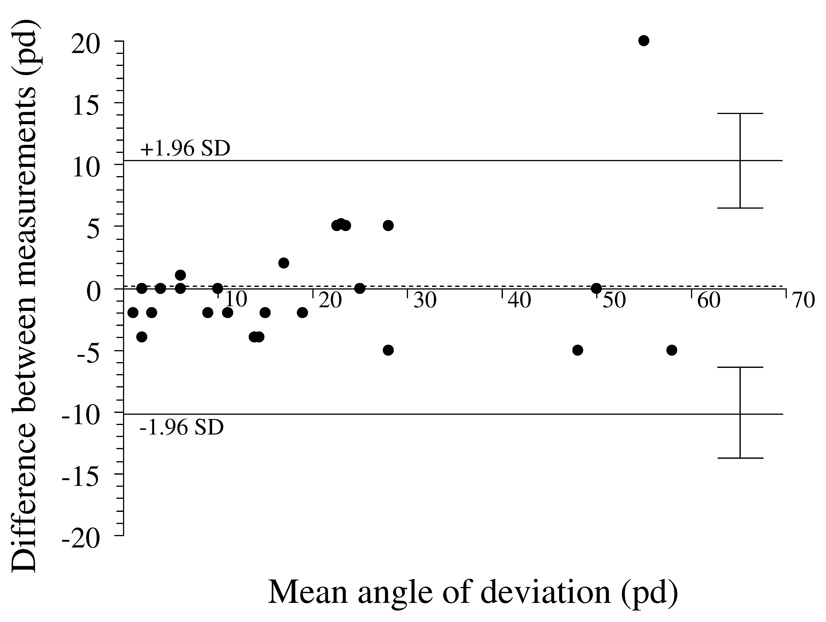
Figure 3.
Test-retest variability of alternate prism and cover test at distance fixation. Bland-Altman plot, showing 95% limits of agreement half-widths (± 1.96 × standard deviation of the difference) to be ± 10.2 pd. Dotted line represents the mean of test-retest differences; 0.2 pd ± 5.2 pd. There appears to be no relationship between magnitude of deviation and test-retest variability. pd = prism diopters

